Our Newsletter
Sign up for our e-mail newsletter and stay informed for what’s next on the horizon.
If you think that comprehending GPU specifications and deciphering benchmarks is a challenging endeavor only for tech experts, we’re here to tell you that it’s not as intimidating as it appears.
Actually, getting a good understanding of these concepts can substantially enhance your ability to make informed decisions when buying a new graphics card.
We’ll assist you in navigating the labyrinth of GPU specs, explaining their real significance, and teaching you how to read benchmark results to predict the performance you might get.
Keep an eye on this, as this knowledge might be vital for your next high-performance computing experience.
In summary, through a thorough understanding of benchmarks and GPU specifications, we can confidently choose a card that fulfills our computational requirements.
The evaluation of data facilitates well-informed decisions and prevents potential issues. Remember, higher scores indicate faster speeds, so scrutinize the specifications, assess scores, and decide intelligently.
This technical process may be demanding, but trust us, the effort put into this task will entirely transform your tech surroundings.
Venturing into the world of GPU specifications, we uncover key aspects such as interface, die size, architecture, memory bandwidth, and core clock frequency that collectively determine the performance of the GPU. The interface, for instance, ascertains a GPU’s compatibility with the motherboard. Choices like PCI Express 2.0 or 3.0 offer different bandwidths for data transfer, which is vital for seamless Graphics rendering.
Die size, which denotes the physical dimensions of the GPU chip, directly impacts its performance and power efficiency. Generally, smaller dies provide superior performance and lower power consumption. Next is the architecture, the core of the GPU, which sets its basic capabilities and limitations.
Memory bandwidth is another significant factor. It serves as the conduit for efficient utilization of onboard video RAM, directly influencing GPU performance. Greater memory bandwidth often results in superior performance in high-resolution gaming and professional applications.
After examining the key specifications that determine a GPU’s capability, it’s time to move towards various kinds of GPU benchmarks, essential tools that offer a solid indication of a graphics card’s performance.
Three main types of GPU benchmarks exist: synthetic, real-world, and game-specific. Synthetic benchmarks put the GPU under intense workloads, driving it to its theoretical maximum performance. On the other hand, real-world benchmarks simulate common tasks such as gaming and rendering, providing a precise assessment of performance. Game-specific benchmarks, as implied, evaluate performance in specific games to meet gamers’ requirements.
Benchmarking software evaluates performance in terms like frames per second (FPS), power usage, and temperature. Comprehending these varied types of GPU benchmarks aids users in making educated choices when comparing graphics card performance.
Here’s a table for better understanding:
| Benchmark Type | Purpose |
|---|---|
| Synthetic | Tests maximum theoretical performance |
| Real-World | Simulates common tasks for precise performance assessment |
| Game-Specific | Evaluates performance in specific games |

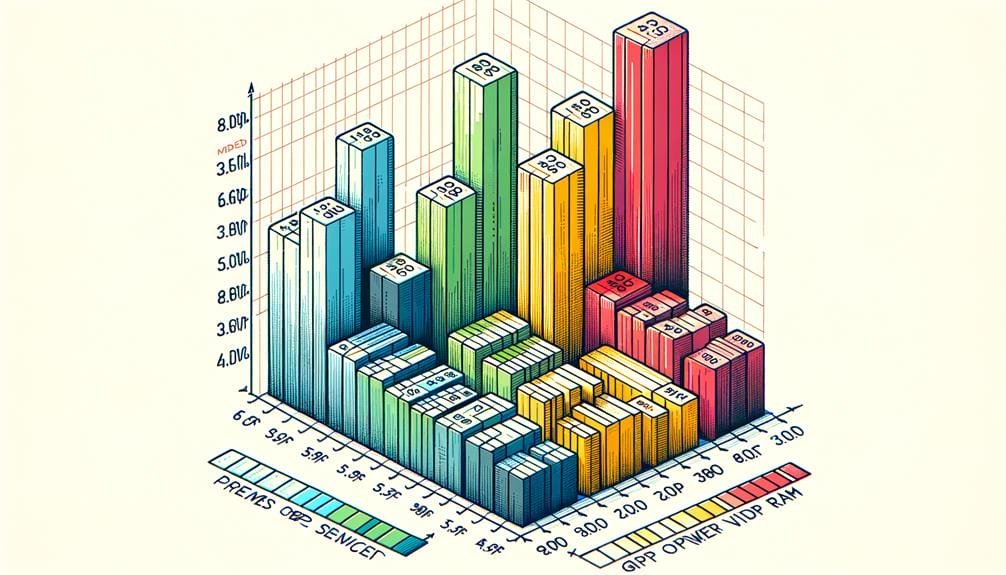
Let’s dive into the process of interpreting GPU benchmark results, a vital skill that allows us to assess the overall performance and efficiency of different graphics cards. A detailed analysis of these results requires understanding key factors such as frames per second (FPS), benchmark scores, percentiles and rankings, as well as other aspects like temperature and power draw.
FPS is a straightforward measure of fluidity in GPU performance. Higher FPS denotes smoother visuals, crucial for gaming and video editing. Benchmark scores, alternatively, offer a holistic performance measure, enabling us to contrast different GPU models. However, they need to be considered in context, taking into account the specific tasks you’ll be using the GPU for.
Percentiles and rankings provide us with a relative view, demonstrating how a specific GPU performs compared to others. This assists in determining if it delivers optimal performance for its price. On the other hand, temperature and power draw present insights into the GPU’s efficiency and longevity. A GPU that maintains high performance while keeping temperature and power draw low indicates superior efficiency. Therefore, interpreting GPU benchmark results isn’t merely about numbers, but comprehending their real-world implications.
When delving into GPU capabilities, we encounter several benchmarking software tools that are instrumental in evaluating and contrasting various graphics cards. Such tools as 3DMark, Nova Bench, Cinebench, FurMark, and Unigine Heaven each provide distinct functionalities to process data and produce results for GPUs.
3DMark, a highly esteemed benchmarking software, provides a comprehensive 3D Mark score. This broad metric encapsulates the core of GPU performance. Nova Bench, conversely, is easy-to-use, delivering not only performance data but also advice for optimization.
Cinebench distinguishes itself with its Open GL mode, allowing us to examine a range of GPU abilities, while FurMark pushes your GPU to its limits, gauging its stability and cooling proficiency. Unigine Heaven stretches the boundaries of visual capabilities in a virtual setting, providing a breathtaking testing platform.
Here’s a brief overview:
| Software | Strengths | Best For |
|---|---|---|
| 3DMark | Comprehensive Score | Overall Performance |
| Nova Bench | User-friendly, Optimization Suggestions | Beginners, Optimization |
| Cinebench | Open GL Mode | Diverse Capabilities |
| FurMark | Stress Testing | Stability, Cooling |
| Unigine Heaven | Visual Test | Graphical Capabilities |
Selecting the appropriate benchmarking software depends on the specific test requirements of the users and the depth of detail they require.

To evaluate the performance of specific graphics cards, we first need to understand the main GPU performance indicators.
Following this, we’ll examine and contrast the performance of various graphics cards using these indicators as a baseline.
To fully comprehend the efficiency of a specific graphics card, we must examine critical GPU metrics such as frames per second (FPS), memory clock speed, core clock frequency, DirectX and OpenGL compatibility, and memory bandwidth. A higher FPS results in smoother gameplay or video rendering, while the GPU benchmark serves as an accurate gauge of overall performance.
Memory clock speed intertwined with memory bandwidth affects the GPU’s capability in managing memory-intensive tasks. Conversely, the core clock frequency determines how fast the GPU functions. DirectX and OpenGL compatibility, essential for interpreting game graphics, impact the GPU’s performance in certain applications.
A thorough evaluation of these metrics offers a complete understanding of the GPU’s capabilities and limitations.
Turning our attention, let’s examine the specifics of various graphics cards’ performances, beginning with the NVIDIA GeForce RTX 3080 which boasts a 30% increase in gaming benchmarks over the RTX 2080 Ti. It’s vital to weigh these GPUs against each other to find the best for your needs.
Observe the table below for a thorough comparison:
| GPU | Gaming Benchmark | VRAM |
|---|---|---|
| RTX 3080 | 30% better than 2080 Ti | 10GB |
| RX 6800 XT | Surpasses RTX 3070 in 4K | 16GB |
| RX 6900 XT | – | 16GB |
| RTX 3070 | – | 8GB |
| RTX 3060 Ti | Exceptional cost-performance ratio | 8GB |
It’s clear that each GPU showcases unique advantages. From gaming to VRAM capacity, the performance varies considerably, affecting your liberty to choose.
After examining the benchmarks and specifications of various GPUs, let’s discuss how these numbers affect actual gaming experiences.
The particular performance measures of a graphics card directly affect the quality of your gaming.
Comprehending these aspects offers us the opportunity to improve our gaming experience and make knowledgeable decisions.

Presently, we’ll take on the task of interpreting GPU benchmark scores. We initiate our journey by comprehending the benchmark figures, aiding us in making sense of the raw data these scores reveal.
Following this, we’ll proceed to contrast various GPU scores, offering a pragmatic viewpoint on what these figures signify in an actual scenario.
Analyzing GPU benchmark values, an essential part of assessing a graphics card’s capabilities, aids us in effectively contrasting diverse models and making knowledgeable choices based on our unique needs. These benchmark values indicate the relative performance potential, guiding us in the selection of a GPU.
To read benchmark values, take into account these vital points:
Comprehending these values enables us to evaluate real-world outcomes, ensuring we possess the flexibility to pick the most fitting GPU.
Evaluating diverse GPU scores requires a keen comprehension of GPU benchmark outcomes. This knowledge is essential in reaching informed conclusions regarding the most suitable graphics card for our unique real-world application requirements.
We employ benchmark software to collect data such as frames per second (FPS), temperature, power draw, and noise levels. These metrics assist in interpreting GPU benchmark scores by enabling a comparison of the performance of different graphics cards under the same conditions.
Grasping GPU performance goes beyond mere speed; it encompasses efficiency, stability, and the ability to produce fluid, high-quality visuals. By scrutinizing these scores, we can ascertain the GPU that will fulfill our requirements most effectively, providing us with the ability to select the appropriate instrument for our computational tasks.
In finalizing our investigation, the A100 GPU emerges as the preferred choice for optimal throughput performance, while the RTX4000 GPU stands out for its excellent cost-effectiveness per GB/minute. Our benchmark tests have illuminated these GPUs capabilities across a range of applications.
Wrapping up, by gaining a deeper insight into benchmarks and GPU specifications, we can assuredly select a card that meets our computing needs.
Analyzing data aids in making informed decisions and avoiding setbacks. Keep in mind, high scores denote superior speeds, so examine specifications, review scores, and make your choice wisely.
This technical journey may be challenging, but believe us, the effort invested in this activity will completely upgrade your tech environment.
We’re examining GPU benchmark scores. This is a numerical measurement that reflects the performance of a GPU, considering components such as FPS, temperature, and power consumption. Superior benchmark scores imply enhanced performance and abilities.
We recommend concentrating on GPU specs like the connection type, the size of the semiconductor, and the design. Don’t overlook the memory transfer rate and the speed of the core clock. Also, consider compatibility with 3D APIs and the needs of the RAMDAC. It’s simple, isn’t it?
Indeed, a 10000 benchmark score is considered good. It demonstrates the GPU’s capacity to handle complex tasks effectively, delivering uninterrupted performance for applications and games that are heavy on graphics. Superior scores denote remarkable performance and capability.
It’s not feasible to provide a one-size-fits-all answer for what constitutes good benchmark scores, as they are contingent on the benchmarking application and the specific test being run. For instance, a score ranging from 5000 to 10000 points is considered satisfactory for 3DMark. In the realm of gaming, achieving more than 60 FPS is desirable.
Sign up for our e-mail newsletter and stay informed for what’s next on the horizon.